

Boundary Studio
Deprecation notice: Boundary Studio v1 at app.boundaryml.com will be deprecated by end of March 2026. Please migrate to the new Boundary Studio at studio.boundaryml.com.
Getting Started
To enable observability with BAML, sign up for a Boundary Studio account.
Once you’ve signed up, create a new project and get your API key. Then add the following environment variable before running your application:
That’s it — your BAML function calls will now be traced automatically.
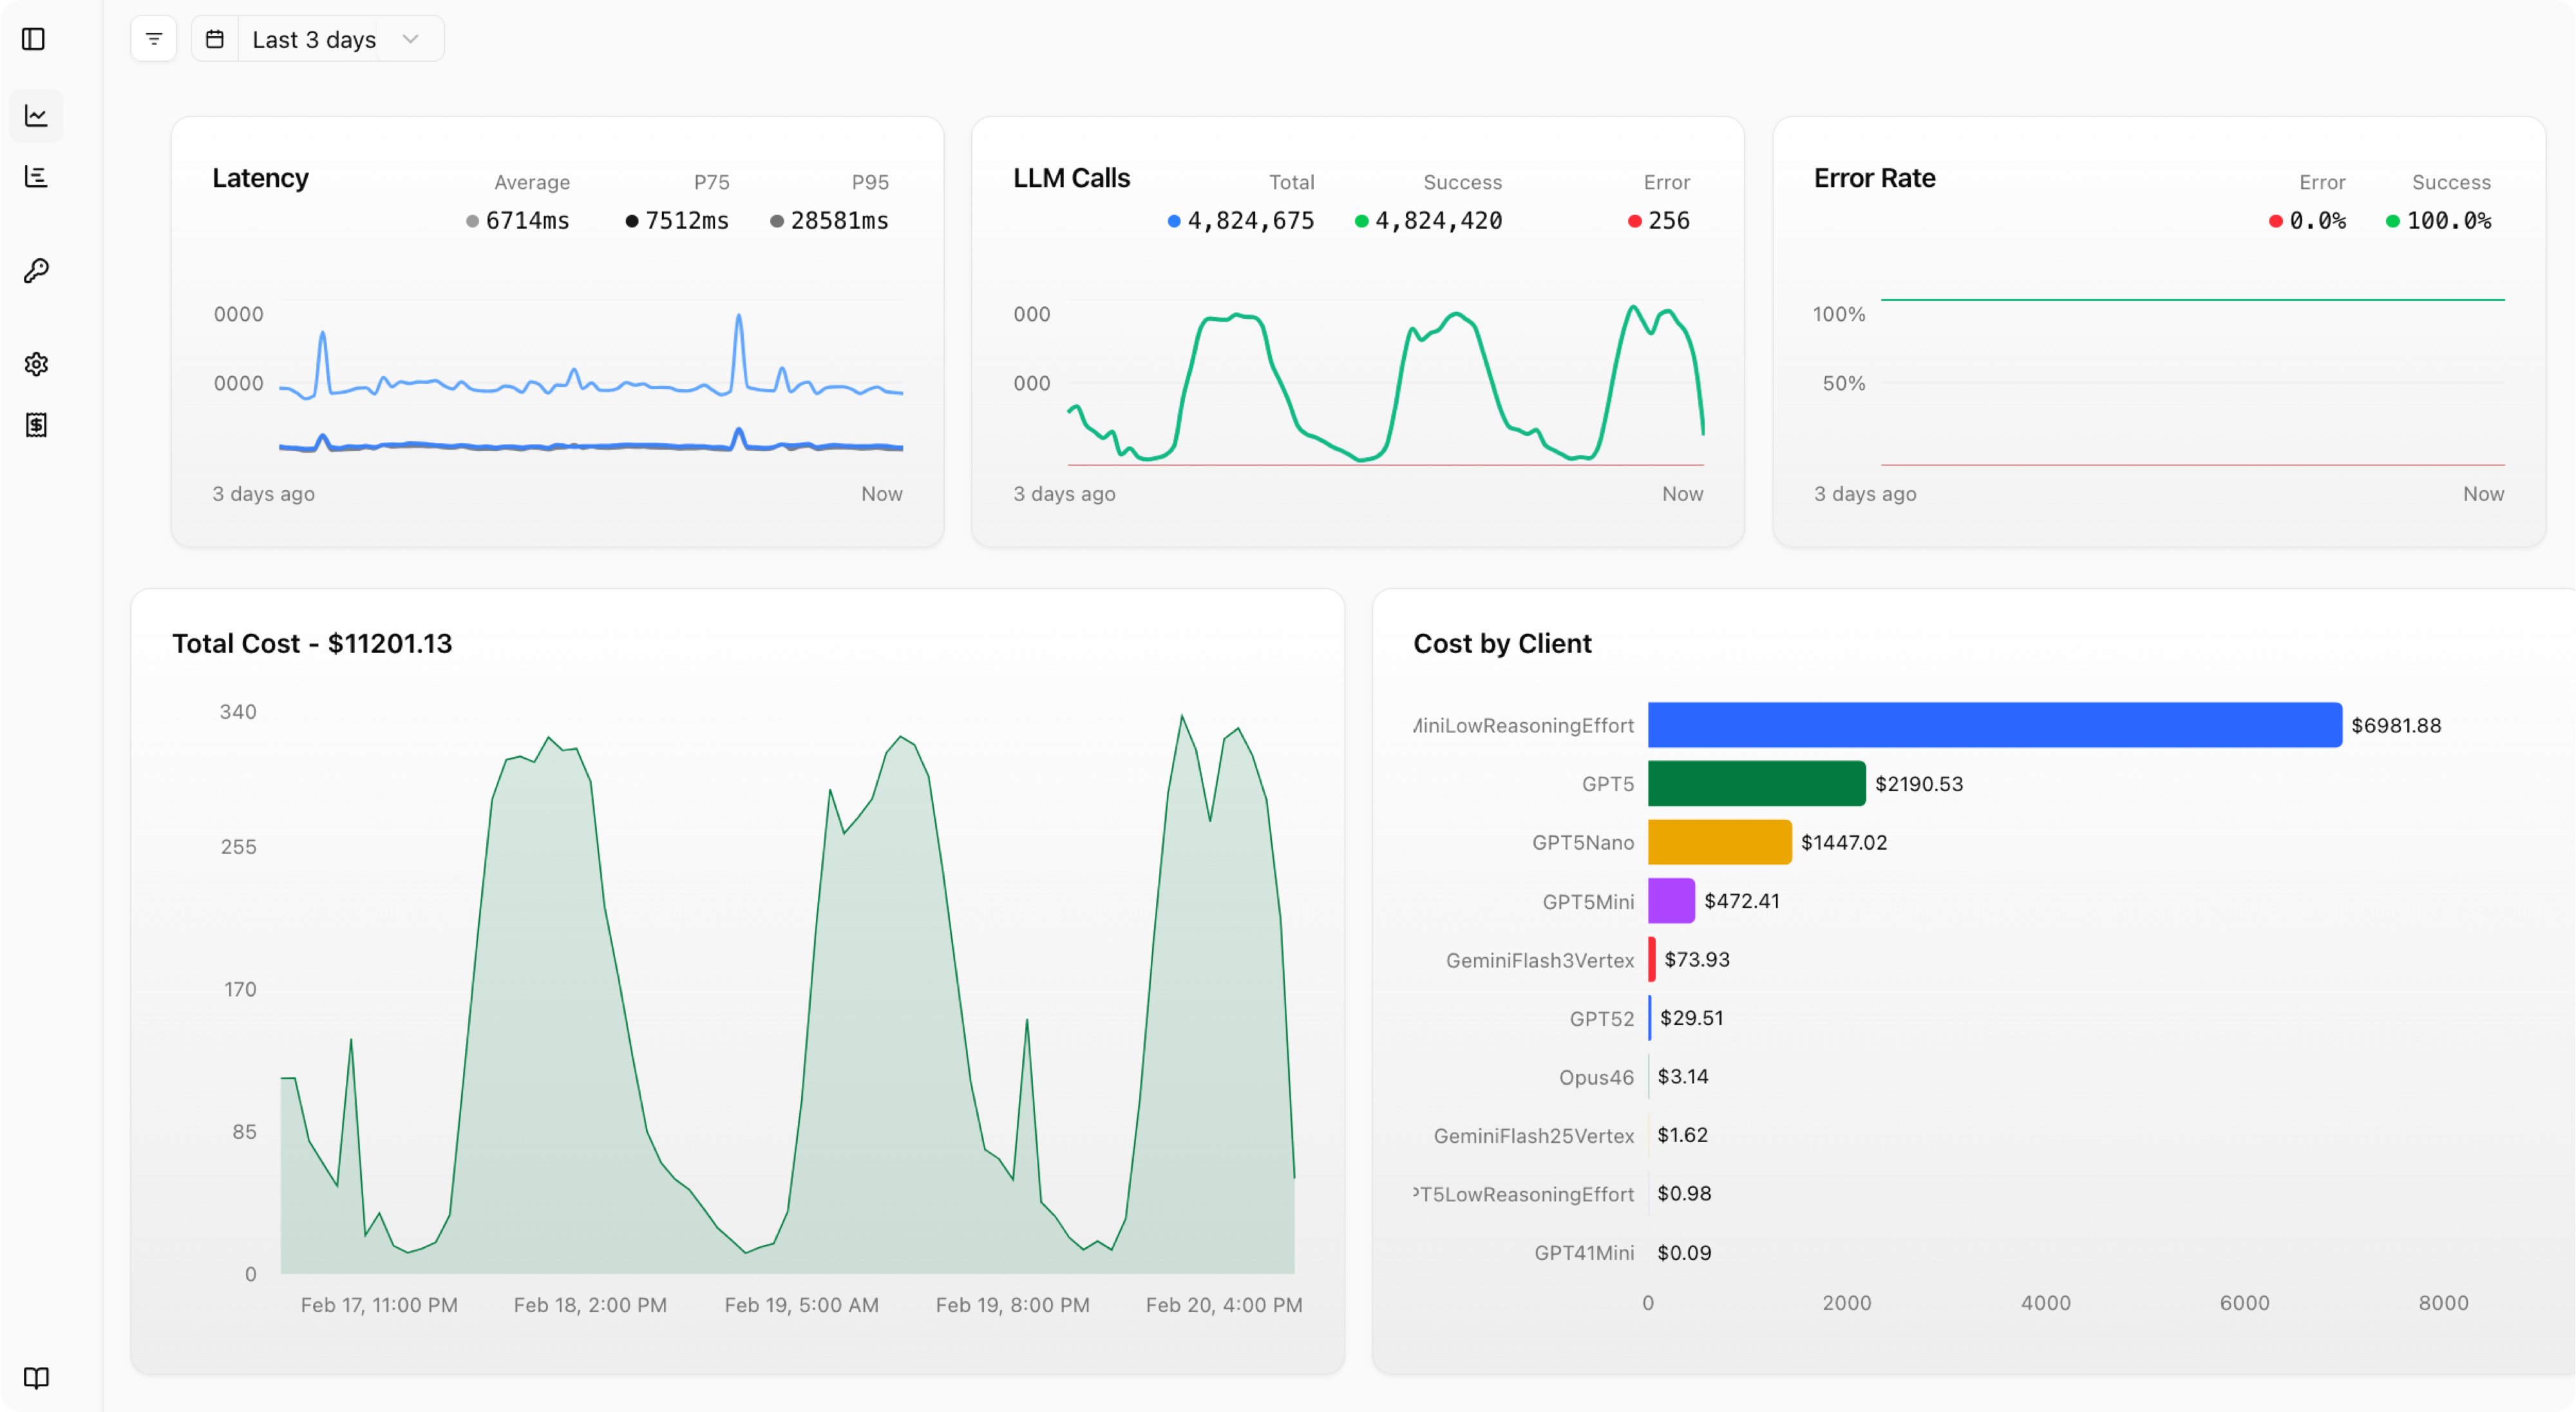
Dashboard
The dashboard gives you a high-level overview of your LLM usage across all your BAML functions
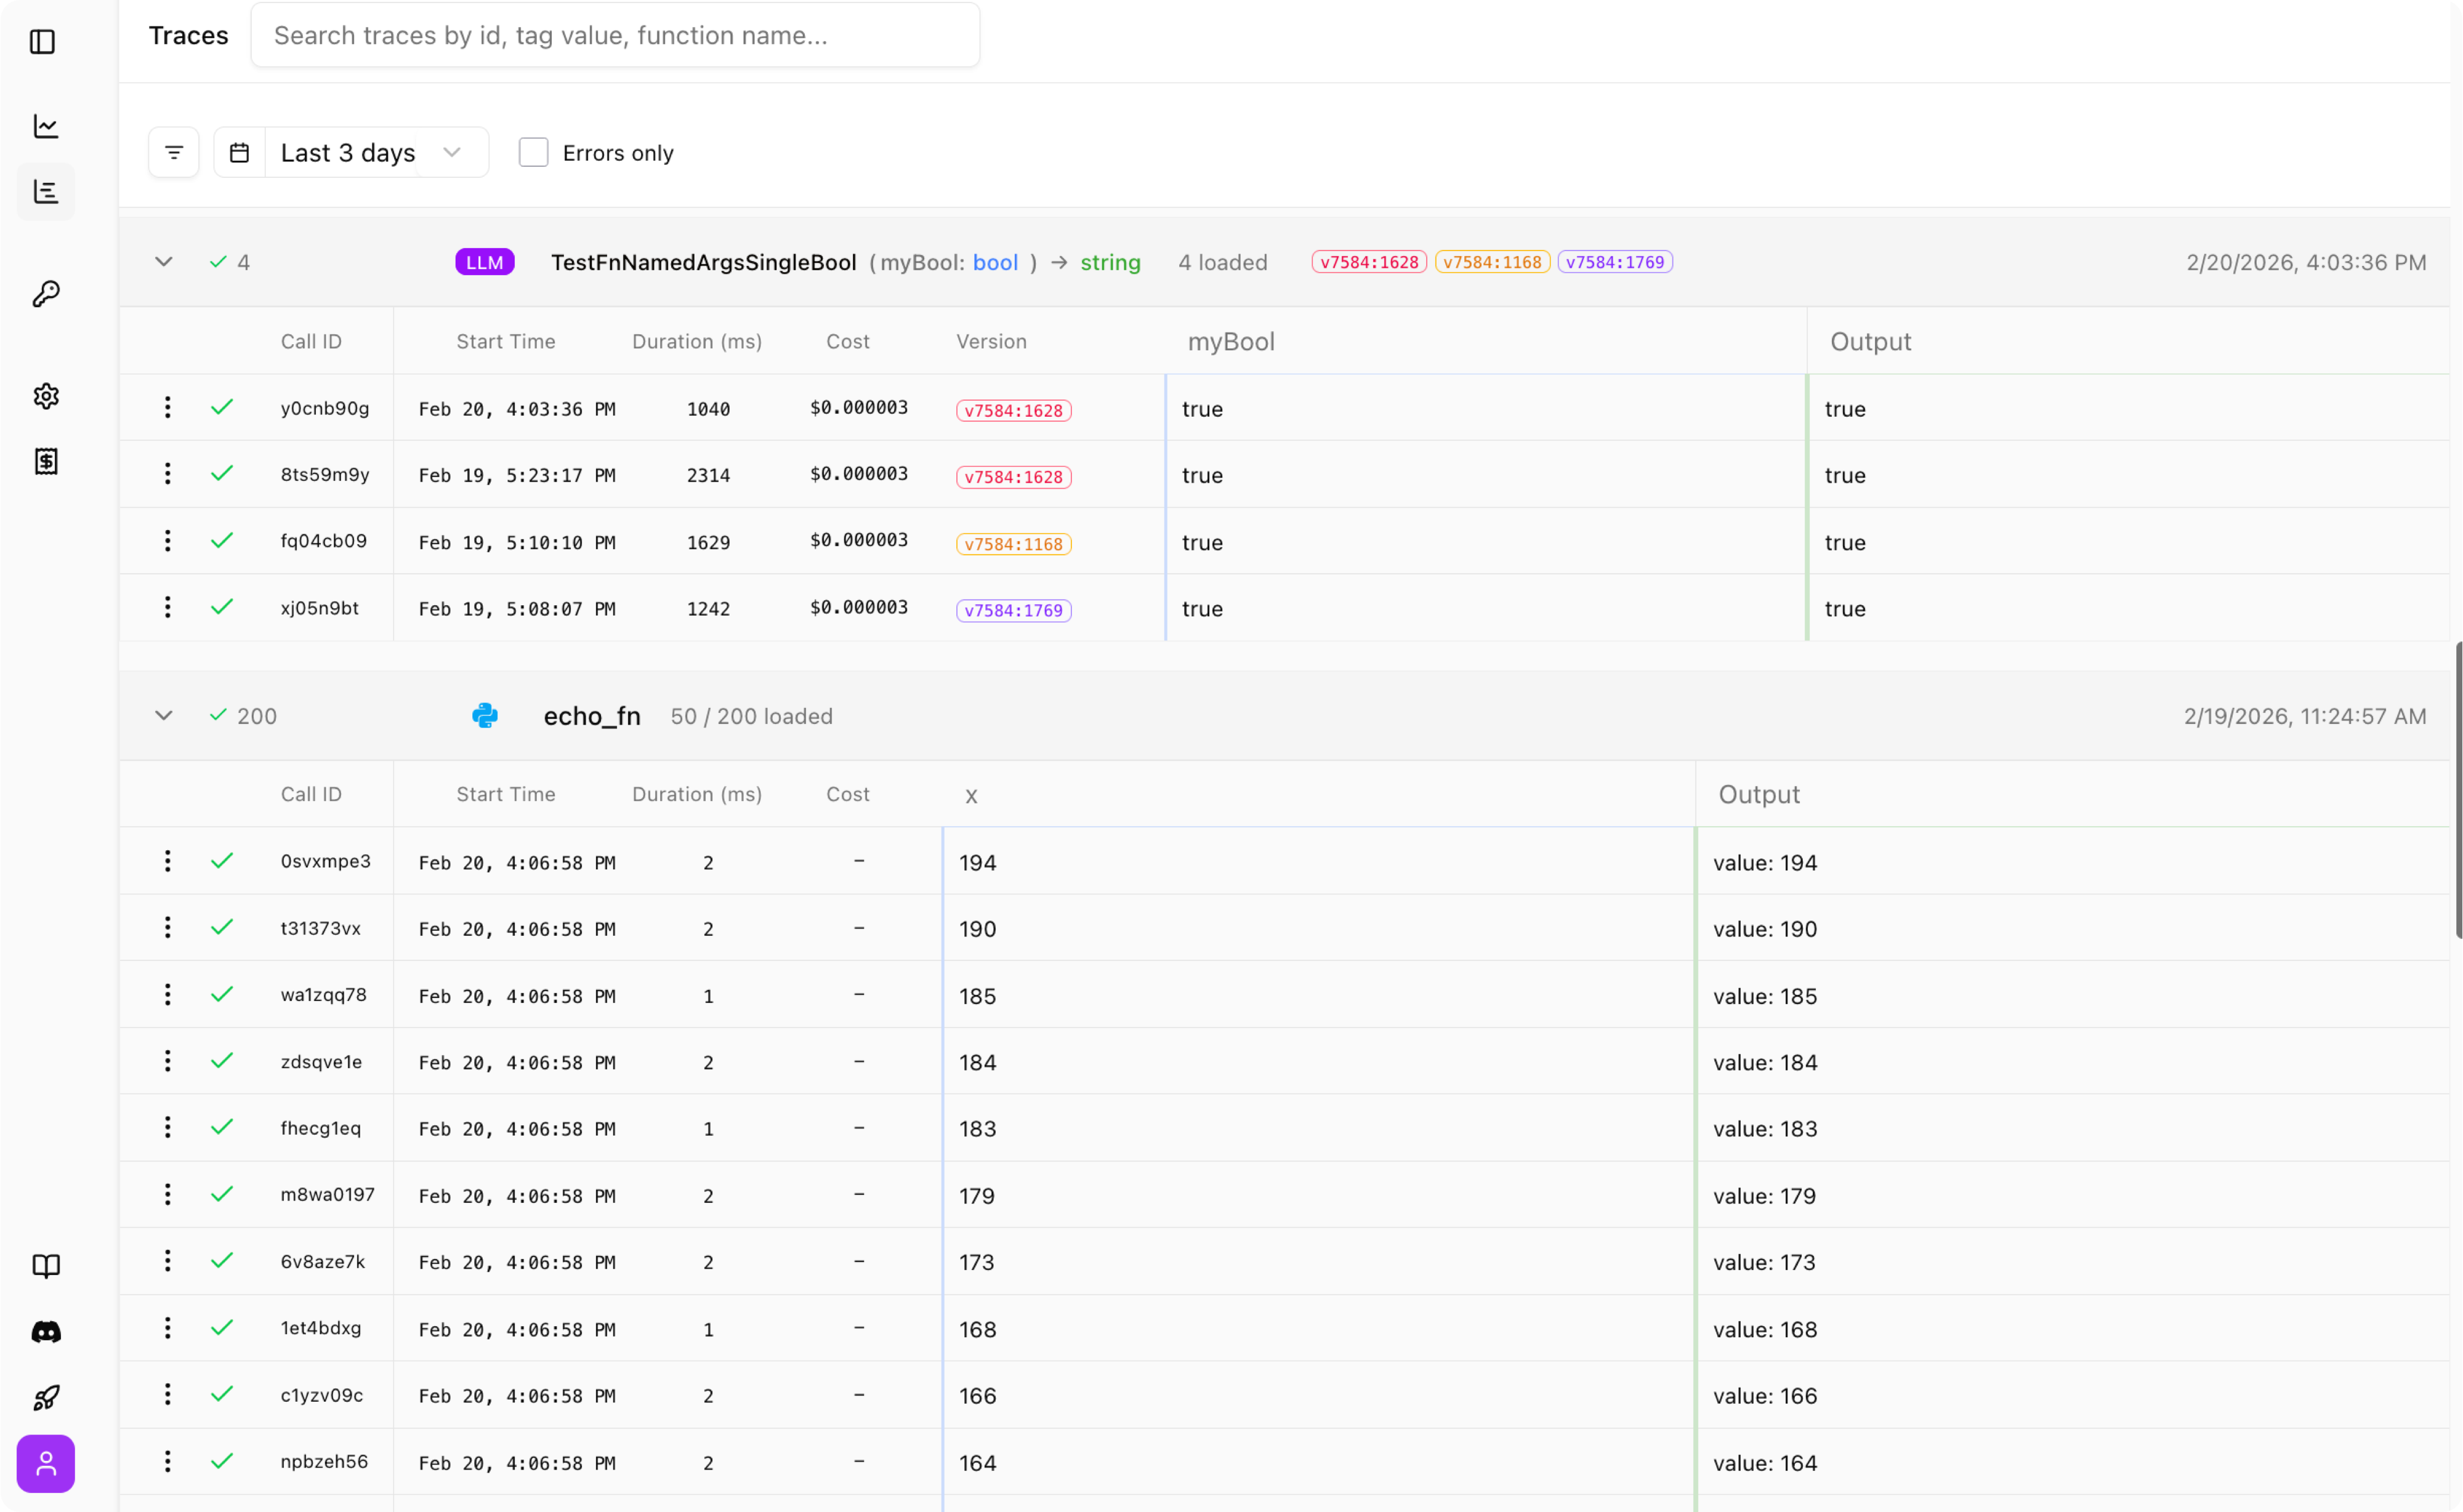
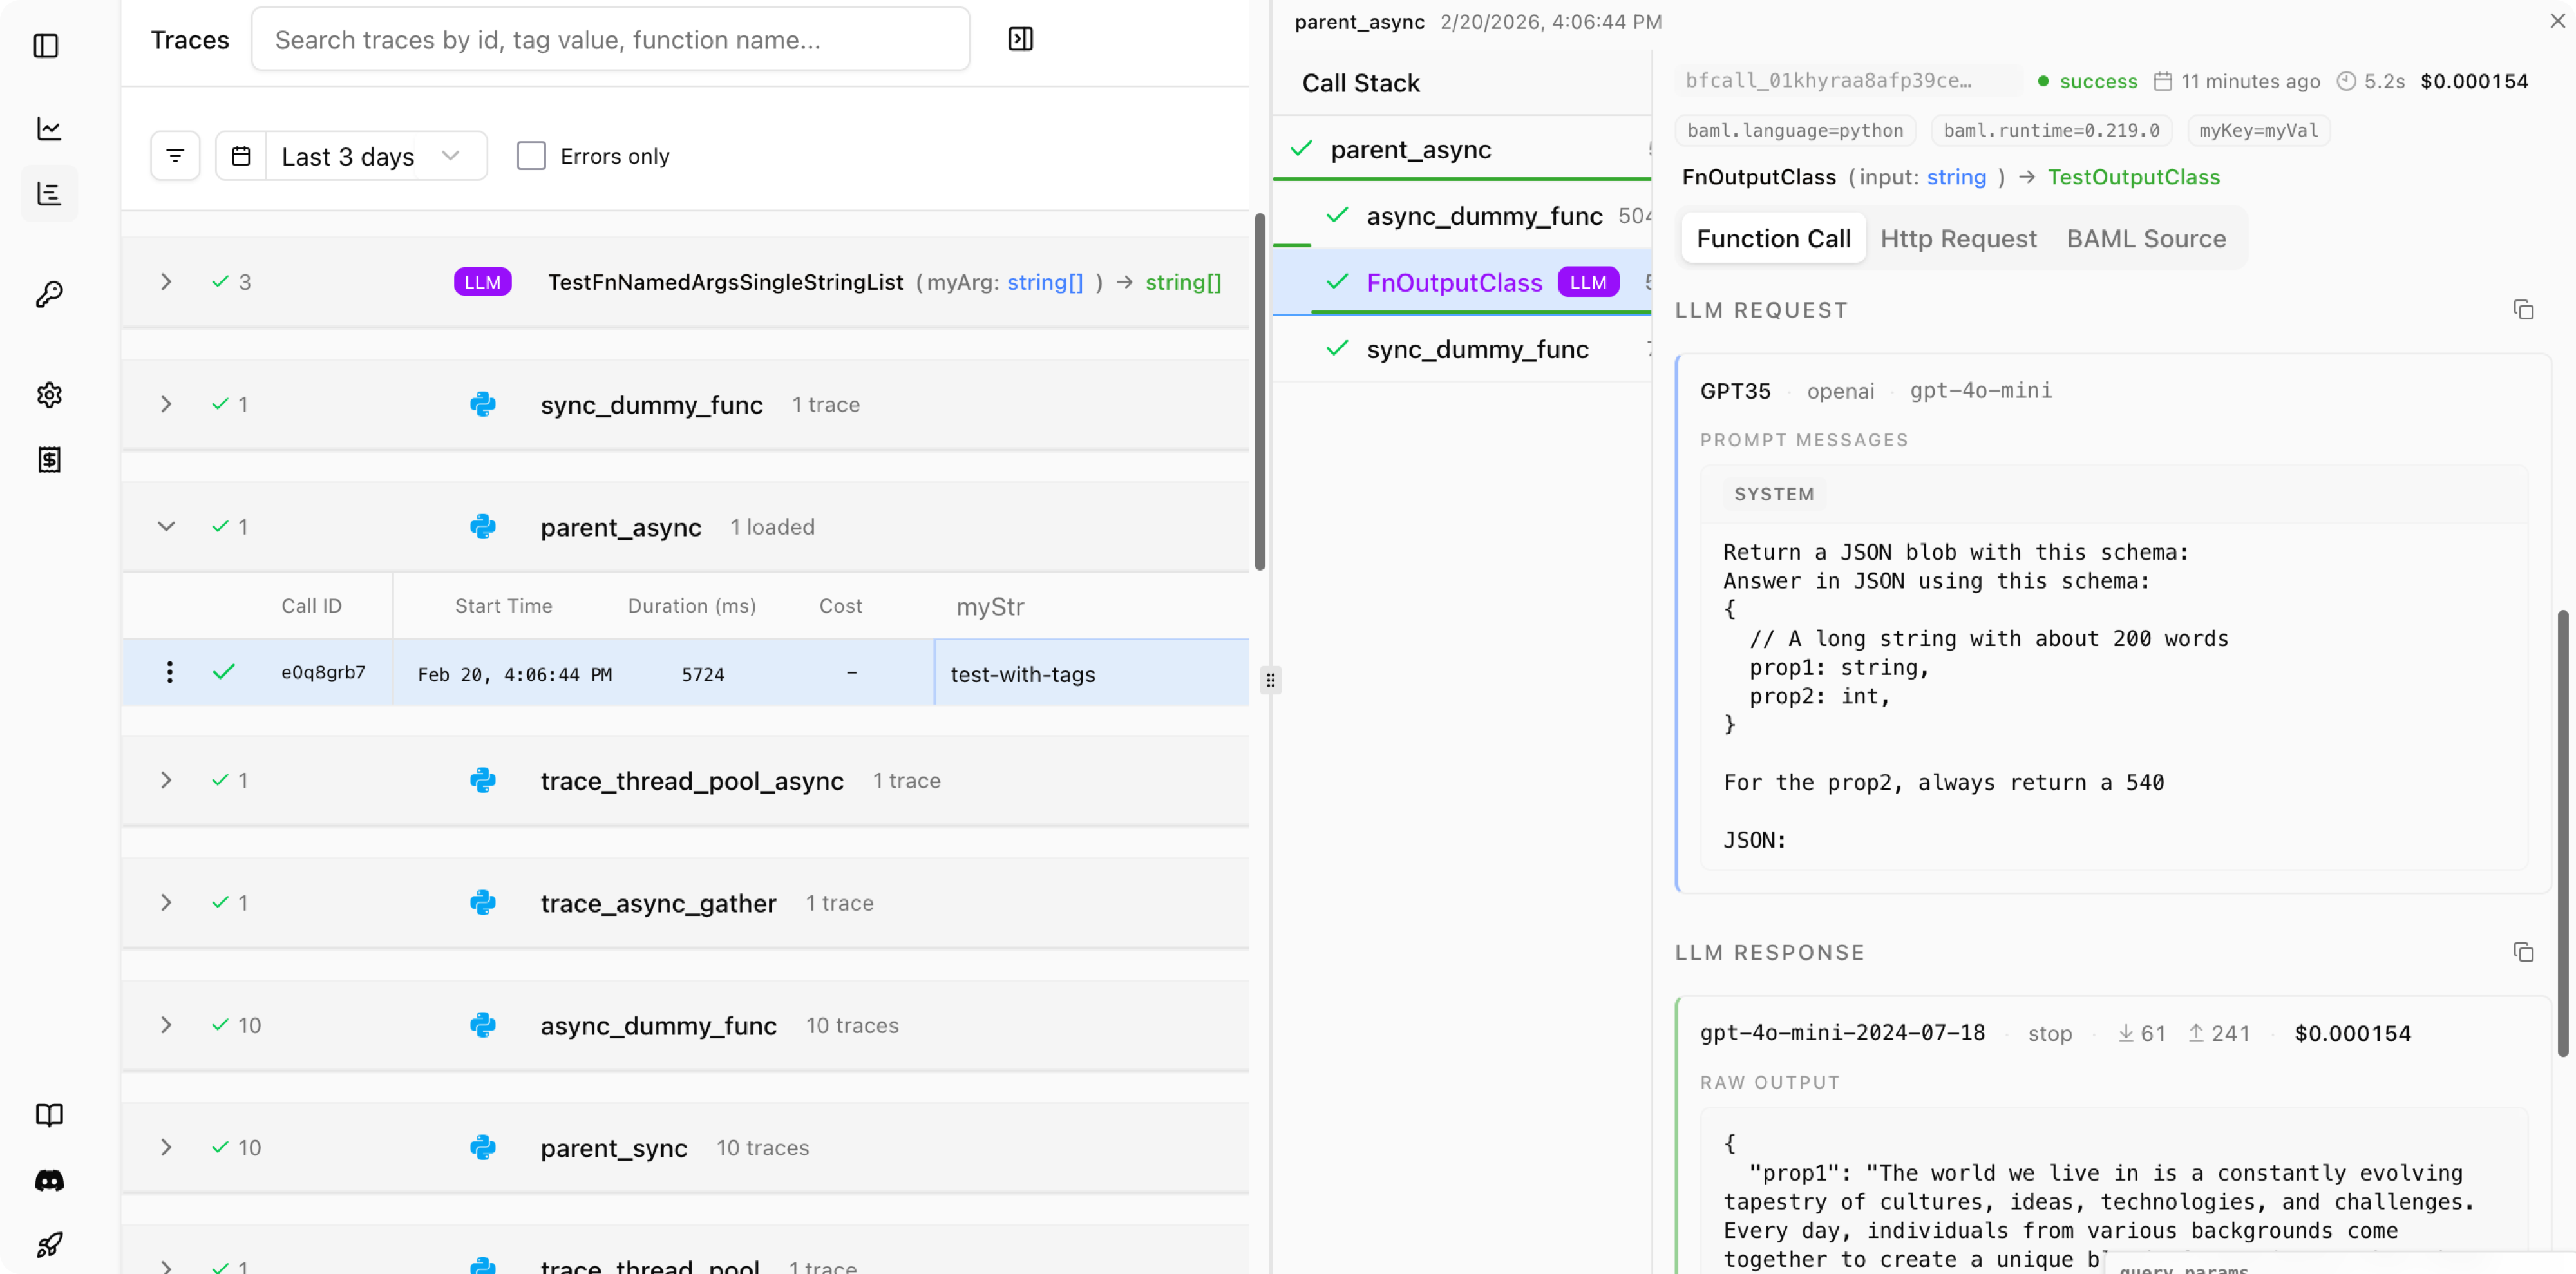
Traces
The traces view lets you inspect every LLM call your application makes. Since Studio has access to the BAML definitions, it can represent your traces as functions, with typed parameters, inputs and outputs. Other observability platforms can only show you raw json blobs, which makes it hard to connect your data to your code.
Tracing Custom Events
BAML allows you to trace any function with the @trace decorator. This will make the function’s input and output show up in the Boundary dashboard. This works for any python or Typescript function you define.
BAML LLM functions (or any other function declared in a .baml file) are already traced by default. Logs are only sent to the Dashboard if you setup BOUNDARY_API_KEY environment variable.
Example
In the example below, we trace each of the two functions pre_process_text and full_analysis:
Adding custom tags
The dashboard view allows you to see custom tags for each of the function calls. This is useful for adding metadata to your traces and allow you to query your generated logs more easily.
To add a custom tag, you can import set_tags(..) as below:
Tags on BAML calls and retrieving them with the Collector
You can also set tags directly on a BAML function call and then retrieve them from the Collector. Tags from a parent trace are inherited by the BAML function call and merged with any function-specific tags you pass.
Python
TypeScript
Go
Notes:
- Tags from
set_tags/setTagson a parenttraceare merged into the BAML function’s tags. - Per-call tags are provided via
baml_optionsin Python and the options object in TypeScript; in Go useb.WithTags(map[string]string). - Retrieve tags from a
FunctionLogusinglog.tags(Python/TypeScript) orlog.Tags()(Go).
Tracing with ThreadPoolExecutor (Python)
When using Python’s concurrent.futures.ThreadPoolExecutor, traced functions submitted to the thread pool will start with fresh, independent tracing contexts. This is by design and differs from async/await execution.
Expected Behavior
In the trace hierarchy, you’ll see:
parent_functionas a root trace (depth 1)worker_functionas an independent root trace (depth 1) - not a childprocess_dataas a child ofworker_function(depth 2)
Why This Happens
Python’s contextvars (used for tracing context) don’t automatically propagate to thread pool threads. Each worker thread starts with a fresh context to:
- Avoid complexity with context sharing across threads
- Prevent potential race conditions
- Maintain clear thread boundaries
Best Practices
- Use async/await for related work: If you need to maintain parent-child relationships for parallel execution, use
asyncioinstead of thread pools:
-
Understand the trace hierarchy: When debugging, remember that thread pool workers appear as separate root traces in your observability dashboard.
-
Tags don’t propagate: Tags set in the parent function won’t automatically appear in thread pool workers since they have independent contexts.